[et_pb_section fb_built=”1″ admin_label=”section” _builder_version=”4.21.2″ custom_padding=”20px||20px||true|false” global_colors_info=”{}”][et_pb_row admin_label=”row” _builder_version=”4.16″ background_size=”initial” background_position=”top_left” background_repeat=”repeat” global_colors_info=”{}”][et_pb_column type=”4_4″ _builder_version=”4.16″ custom_padding=”|||” global_colors_info=”{}” custom_padding__hover=”|||”][et_pb_text admin_label=”Text” _builder_version=”4.21.2″ link_font=”|700|||on||||” link_text_color=”#215921″ header_2_font=”|600|||||||” header_2_text_color=”#215921″ background_size=”initial” background_position=”top_left” background_repeat=”repeat” global_colors_info=”{}”]
Have you ever set students up for failure? Well, if you’ve ever advised students to study X number of hours for every hour of class time, then you have set them up for failure. No worries. You didn’t intend to harm them. But by encouraging students to use time to measure their learning, you have inadvertently set them up with a faulty learning metric. And this specific metric leads many students down a path of repeated frustrations and failures.
Let’s discuss metrics.
Every field uses metrics to track different levels of performance or production. Metrics help us gauge our success. For example, a sports team might use wins versus losses as a bottom-line metric. An online marketing company might use page views to measure the success of a campaign. A college admissions department will use the number of applicants as a middle metric to project the incoming class size. The key point is that metrics matter, so we must use the right metrics.
I’m convinced that many students and educators use the wrong metrics to measure academic work. These unspoken gauges are behind many of the discrepancies between faculty and students. Educators who recognize this issue have tried to address the problem by using scoring guides, such as rubrics. But the problem remains.
The Source of the Learning Metric Problem
Studying is a feeling process. This means that students are rarely certain that their study habits are adequate. Instead, they rely on feelings of preparedness. The key to unraveling this issue is to understand the mechanisms that trigger students’ readiness feelings.
Researchers suggest that students’ work is guided by two interdependent affective factors: judgments of learning and feelings of knowing. Judgments of learning (JOL) are predictions that students make about future performance based on self-assessments of items they believe they’ve learned. Feelings of knowing (FOK) are predictions students make about future performance based on items they believe they have not yet mastered.[1]
When you put JOLs and FOKs together, you get the essence of a student’s study experience. When these metrics are triggered, the student’s knowledge confirmation system (KCS) is triggered, and they feel prepared. When these metrics are correct, the system leads the student to success. But when the system is misaligned with their educator’s system, as it so frequently is, it leads the student to false confirmations.
An Example of Faulty Metrics
In 2014, I helped a university redesign its first-year seminar program. As a compromise to entice faculty to teach the course, professors were allowed to teach courses that personally interested them. Students could then choose a course that most suited their interests. One of the courses was entitled Music through the Ages. About midway through the first semester, a student I’ll call Molly came to my office in tears because she was making Ds in this course.
Molly was doubly mad. She was unhappy that she was performing poorly, but she was most hurt by the fact that she signed up for this course because she was a DJ. When she came to my office, she shared numerous pictures on her phone of her DJing at numerous events. But unfortunately, Molly’s familiarity with and love for music was not enough to help her academic performance.
When I analyzed Molly’s notes, I immediately saw her problem. Molly had meticulous notes on the content that had been covered during class. However, she had misinterpreted the nature of the course. Molly believed the course required her to create a mental inventory of what artists produced which songs throughout history. After speaking with Molly about this issue, I could see how she came to the wrong conclusion. The professor spent much of his time covering various popular artists and their works each day in class. So she believed her job was to create a robust memory-and-retrieval system for the items discussed in class. And she did that very well.
I immediately recognized the metacognitive nature of Molly’s problem. But I had to get her to see the problem, and I had the perfect tool for the job.
A Tool for the Problem
Molly was stuck using the wrong learning metrics. The metrics she used confirmed her knowledge at the wrong cognitive levels. All of her mental activity was devoted to capturing each artist, genre, and time period that her professor presented during class. Once she had this data, she then focused on organizing the items in her mind to make them most retrievable. While this mental labor was taxing, it did not produce the types of outcomes her professor was seeking. I had to help Molly break this cycle, so I introduced her to the Learning Sufficiency Diagram.
The Learning Sufficiency Diagram is an advanced metacognitive tool that changes students’ academic appetites. I use this tool to heighten students’ sensitivity to the internal mechanisms that make up their knowledge confirmation systems. Students who can control the points at which their systems are triggered will be effective managers of their own learning.
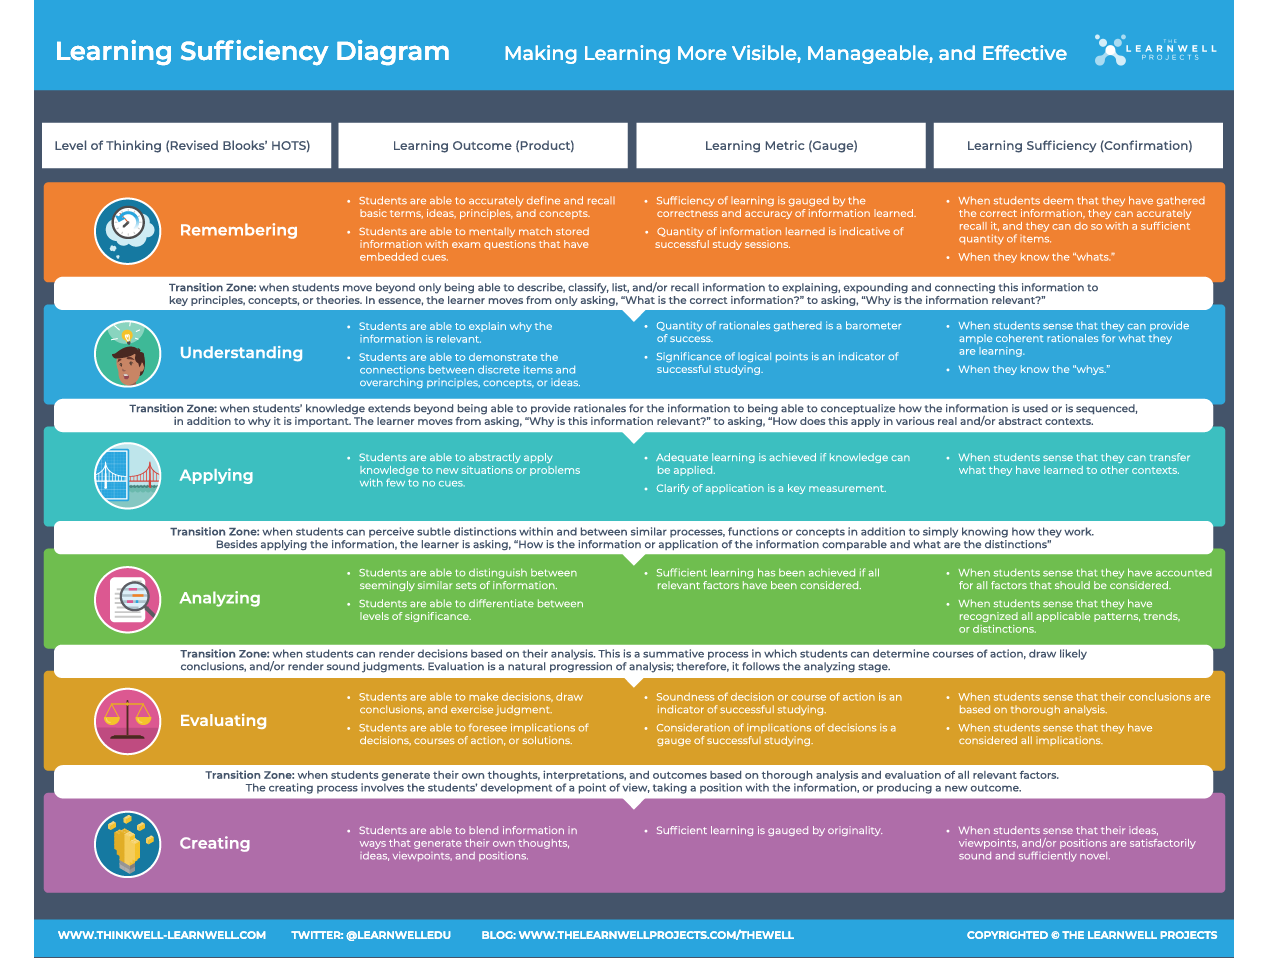
Download the Learning Sufficiency Diagram at thelearnwellprojects.com/tools.
I knew that Molly would consistently produce the wrong outcomes if she used the wrong metrics, regardless of how much she studied. I needed to shift her metrics from time to quality of thinking. Here’s how I assisted Molly:
- Increase Molly’s metacognitive awareness. Following the rows in a left-to-right fashion, I made Molly aware of the connections that were implicitly occurring in her mind. As she interacted with the class content, her mind automatically generated outcomes. But she was unaware of the mechanisms controlling this process. Since she lacked awareness of these mechanisms, she focused on the one element that she felt she could control: She figured that if she studied “long enough,” then success would be inevitable. But after using this diagram, she began to see that time was a poor metric.
- Shift Molly’s metrics. Now that Molly connected the knowledge products, metrics, and confirmation signals that were operating in her mind, she could establish new cognitive performance metrics. Molly shifted her outcomes (e.g., knowledge products) from the remembering row to the analyzing row. This shift changed the direction of her thinking and completely rewired her knowledge confirmation system.
- Make the change intelligible. I had Molly write a brief overview of the changes she experienced in her thinking. In order to ensure Molly could reproduce this type of cognitive activity again, I wanted her to articulate what happened. This would provide some evidence that she was gaining control of her cognitive experiences.

Learning Metric Problem Solved
After switching from a time-based performance metric to a cognitive-based learning metric, Molly’s approach to class completely changed. Even though her professor still taught the same way, Molly’s new analytical thinking transformed what she extracted from class and how to process the content outside of class. She was now pondering the relationships between the music artists produced at various times and the societal conditions that were happening at that time. For example, she saw new connections between songs that were popular during war times versus those that were popular during times of peace. She became fascinated by the correlations between societal shifts and musical shifts. She began pondering the chicken and egg question that her professor wanted the class to consider: are the artists shaping the culture, or is the culture producing the artists? (She later discovered that this was the professor’s lingering research question.)
As you can imagine, Molly greatly boosted her performance in her first-year seminar course. But what’s more surprising is that Molly grew an even deeper appreciation of music. She was no longer content writing accurate papers about artists and their popular songs. Now Molly was writing about the interplay between society and music. Her new tool and new way of thinking also helped her excel in other courses throughout her college career.
Molly ended up graduating near the top of her class, and when we crossed paths many years later, she told me that the Learning Sufficiency Diagram was her study companion throughout graduate school, from which she graduated magna cum laude.
[1] Zohar, A., & Dori J., Y. (2012). Metacognition in Science Education. New York: Springer.
[gravityform id=”26″ title=”true” description=”true”]
In the next article, I will share key early indicators that students can use to self-assess whether they are on a path toward academic success or headed for frustration and failure.
Let’s chat. Leave a thoughtful comment below, and I’ll send you the following pdf version of this article. It’s a great conversation piece for faculty, staff, and students and offers video links for additional learning.
[pdf-embedder url=”https://thelearnwellprojects.com/wp-content/uploads/2022/09/Learning-Metrics-Quality-Control_f.pdf” title=”Learning Metrics Quality Control_f”]
[/et_pb_text][/et_pb_column][/et_pb_row][/et_pb_section]

2 comments
Jen Wagner
I wish we could see the diagram better to more fully understand it.
Leonard Geddes
Problem solved. Refresh and look again.