
Learning centers are always fighting to show their worth. Too often, we go about it the wrong way.
Like many of you, I’ve spent years answering the same questions: How many students came in? How often? For how long? From which program/courses? We dutifully send usage reports up the chain and hope the numbers are enough to justify our existence. But deep down, we know those reports don’t tell the real story of our impact. We try to use them anyway to tell correlation data stories about how our services help improve student performance.
This article is about a different way forward. I’ll share how shifting from traditional usage dashboards to what I call Trench Data helped reposition learning centers—and their institutions—from a defensive enrollment management posture to something more powerful: enrollment health. When we change the kind of data we collect and how we talk about it, we move from explaining ourselves to driving strategy.
Learning centers have long worked in the trenches of higher education. We’re close to students’ real academic lives, not just their grades, but their epistemological views about learning, their learning tactics and skills, their hurdles, and their turning points. Yet, despite this deep connection, we often find ourselves on the defensive. We measure usage. We report activity. We justify our existence with numbers that fail to capture our true value.
It doesn’t have to be this way.
Through my work with learning centers across North America, I’ve seen firsthand how we can reposition ourselves and our institutions from defensive enrollment management to what I call enrollment health. This shift is more than semantics. It’s a strategic reorientation that ties academic growth directly to enrollment strength.
And it starts with the types of data we capture from each interaction with students.
Why This Matters
When institutional leaders talk about enrollment, the conversation often centers on recruitment or student marketing. But these approaches overlook a powerful lever: student success. The kind of deep, academic support that happens every day in learning centers cannot be matched by flashy outreach campaigns or new programs.
In fact, Amit Prachand, Associate Vice President for Information and Analytics at Northwestern University, stated, at its best, institutional data should provide the “highest resolution picture of students’ daily academic experiences.” Learning center have the best view into students’ academic work experiences.
Every student interaction is a data point. The problem is, we’ve been using that data to count, not to think. That’s where the Trench Data approach comes in.
From Loyalty Cards to Learning Centers

Let me explain it like this.
Grocery stores don’t give you loyalty cards just to hand out discounts. The discount is the bait. The real payoff is the data. They analyze your purchases, your shopping patterns, even your route to the store, sometimes pairing it with Google Maps data, to make decisions about product placement, pricing, and where to build new locations.
We’re so focused on the 10% off that we miss the bigger picture. The companies don’t.
In the same way, learning centers are focused on usage. How many students showed up and how long they stayed. When we should be analyzing learning behavior, identifying bottlenecks, and generating validated solutions that can transform institutional outcomes.
The Trench Data Dashboard
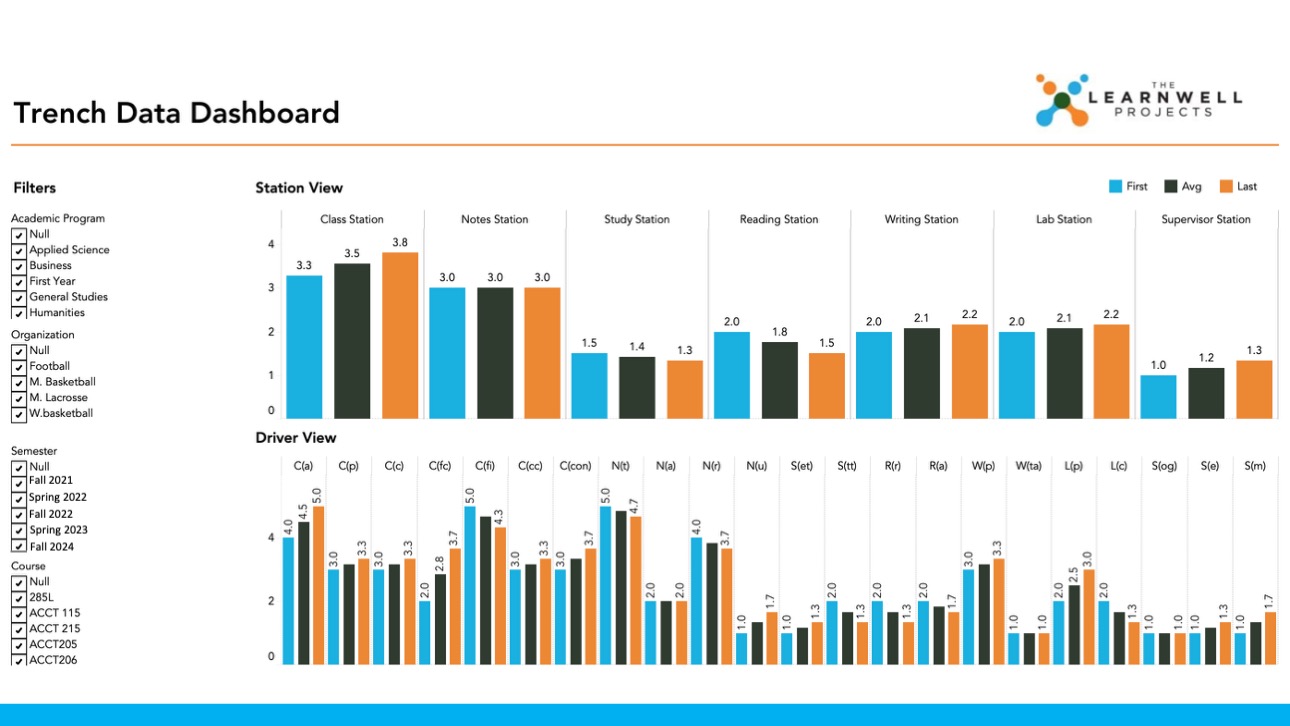
That’s why I developed the Trench Data Dashboard and the Academic Workstation Framework (AFW). The framework breaks down academic work into seven universal stations. These stations give us a way to map, measure, and analyze students’ academic journeys in detail: not just who came in, but what they did, what shifted, and what helped them succeed.
The data makes solutions so obvious that academic problems melt away.
Data Discovery 1
In one institution, we used this approach to uncover why students kept stalling around 68% on exams. It wasn’t about effort or content knowledge. It came down to a specific learning skill that was missing. Once that gap was identified and addressed, performance improved dramatically, and so did faculty buy-in.
Data Discover 2
At another institution, the Dashboard helped unravel a long-standing math mystery. Students consistently reported that they “got it” as they left class, yet their performance collapsed on comprehensive exams. The Trench Data showed that some well-intended instructional “best practices” were actually undermining students’ exam performance. Working from the learning center, we helped faculty adjust their approach and develop targeted support. As the changes took hold, faculty began to see the learning center not as an add-on service, but as an indispensable partner and true co-educator.
Data Discover 3
In a third institution, faculty were overwhelmed by students lining up to be retaught material after class. They felt obligated to keep saying yes, especially in a tight enrollment climate, but the extra help still did not translate into stronger exam performance. By training a small group of students in specific study sequences tied to the Academic Workstation Framework, we showed them how to engage more deeply with material before and during class. The need for reteaching dropped, performance improved, course evaluations went up, and faculty reported feeling far less stressed.
This is the kind of problem-eliminating data institutions crave. But it can only be generated from the trenches.
From Defense to Health
This is what enrollment health looks like.
It’s not just about retaining students. It’s about supporting them in the right ways, at the right times, with the right data. Learning centers are critical to this work, but only if we stop limiting ourselves to usage dashboards and start owning our unique role.
We’re not just support services. We are strategic assets.
And at the end of the day, let’s be honest: it’s cheaper to keep ’em. Building academic strength and enrollment growth together isn’t just good for students. It’s good business. And it’s within reach, if we start thinking offensively rather than defensively.
Learning Centers: If your institution is not knocking down your door to give you more funds and staff, then you are likely trapped in a defensive mindset. You likely view yourself and are viewed by others as a safety net. You should view yourself and be viewed by others as an engine of enrollment health.
Here’s your new tool to go on offense: https://thelearnwellprojects.com/learnwell-trench-data-dashboards/
The ball is in your court. It’s time to think offensively. It’s the only way your institution can achieve its academic and enrollment goals!
For practical guidance on how my work has helped schools go on offense and achieve enrollment health, explore my groundbreaking book.

It’s a guide designed to support both educators and students in making the shift from high performance to deep, lasting learning.
You’ve come this far. Let’s connect in the comments section. Share your reaction below.👇🏿
As always, follow The LearnWell Projects on all your social media platforms and subscribe to my growing YouTube community!
